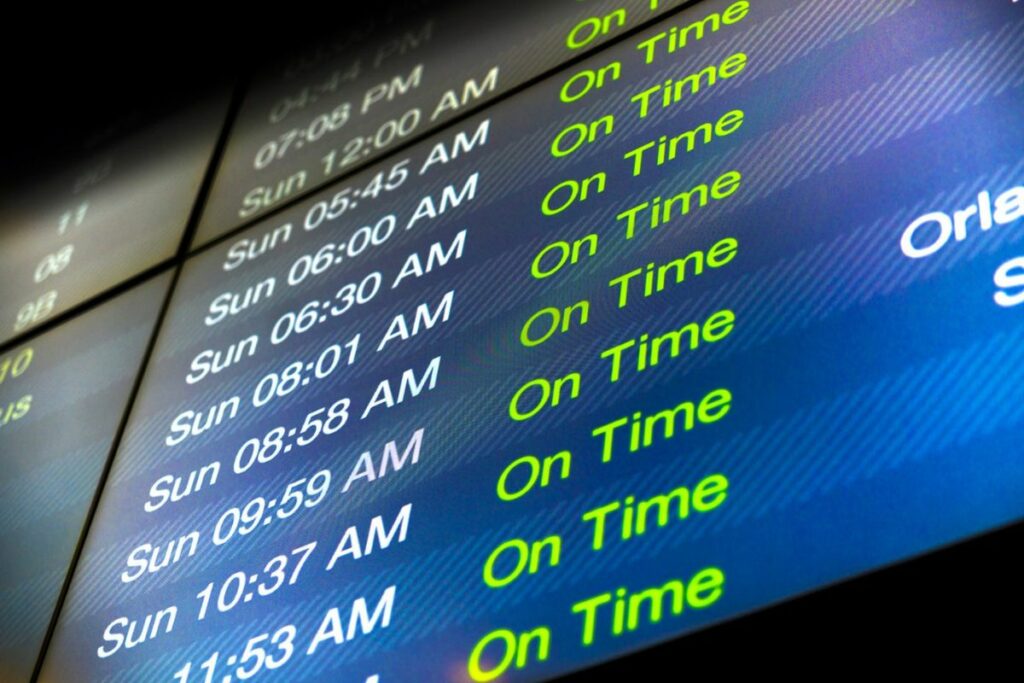
Cirium, an aviation analytics firm, has named Azul Airlines the global leader in on-time performance for 2022. The annual Cirium On-Time Performance Review, the gold standard for airline and airport performance, will be released later this week and will include results from all categories.
According to Cirium, despite a challenging year for the aviation industry, several airlines and airports stood out for their excellence.
Delta Air Lines received the Platinum Award for global operational excellence for the second year in a row. In addition to Delta, other regional winners include Thai AirAsia for the Asia Pacific, Oman Air for the Middle East and Africa, Azul for Latin America, and Iberia for Europe.
StarFlyer was recognized as the top low-cost carrier, and Haneda Airport was named the top airport performer globally.

Criteria For On-Time Performance
According to the review, an on-time flight is defined as one that arrives within 15 minutes of its scheduled arrival time, while an on-time airport is one that departs within 15 minutes of its scheduled departure time.
Top Airlines and Airports for On-Time Performance
World’s Top 10 Airlines for On-Time Performance in 2022
| Airline | On-time ranking | On-time arrival | Total flights |
| (AD) Azul | 1 | 88.93% | 279,722 |
| (NH) ANA | 2 | 88.61% | 162,370 |
| (JL) JAL | 3 | 88.00% | 165,981 |
| (LA) LATAM Airlines | 4 | 86.31% | 451,651 |
| (DL) Delta Air Lines | 5 | 83.63% | 1,004,684 |
| (AV) SA AVIANCA | 6 | 83.48% | 144,525 |
| (EK) Emirates | 7 | 81.30% | 137,589 |
| (UA) United Airlines | 8 | 80.46% | 789,200 |
| (QR) Qatar Airways | 9 | 78.32% | 152,377 |
| (AA) American Airlines | 10 | 78.29% | 1,076,100 |
Top 10 Airports for On-Time Performance in 2022
| Airport | On-time ranking | On-time departure | Total flights |
| (HND) Haneda Airport | 1 | 90.33% | 373,264 |
| (BLR) Kempegowda International Airport | 2 | 84.08% | 201,897 |
| (SLC) Salt Lake City International Airport | 3 | 83.87% | 226,545 |
| (DTW) Detroit Metropolitan Wayne County Airport | 4 | 82.62% | 271,963 |
| (PHL) Philadelphia International Airport | 5 | 82.54% | 233,777 |
| (MSP) Minneapolis-St. Paul International Airport | 6 | 81.95% | 276,346 |
| (DEL) Indira Gandhi International Airport | 7 | 81.84% | 411,205 |
| (SEA) Seattle-Tacoma International Airport | 8 | 81.04% | 383,250 |
| (BOG) El Dorado International Airport | 9 | 80.72% | 273,721 |
| (CLT) Charlotte Douglas International Airport | 10 | 80.68% | 457,871 |
Top 10 Airlines In North America
| Airline | On-time ranking | On-time arrival | Total flights |
| (DL) Delta Air Lines | 1 | 83.63% | 1,004,684 |
| (UA) United Airlines | 2 | 80.46% | 789,200 |
| (AS) Alaska Airlines | 3 | 80.36% | 243,072 |
| (AA) American Airlines | 4 | 78.29% | 1,076,100 |
| (WN) Southwest Airlines | 5 | 74.06% | 1,336,888 |
| (F9) Frontier Airlines | 6 | 68.32% | 170,047 |
| (B6) JetBlue Airways | 7 | 66.35% | 343,673 |
| (G4) Allegiant Air | 8 | 65.93% | 117,469 |
| (WS) WestJet | 9 | 59.10% | 94,663 |
| (AC) Air Canada | 10 | 54.51% | 150,602 |
Top 10 Airlines In Europe
| Airline | On-time ranking | On-time arrival | Total flights |
| (IB) Iberia | 1 | 85.87% | 91,154 |
| (UX) Air Europa | 2 | 84.10% | 48,163 |
| (I2) Iberia Express | 3 | 83.80% | 35,665 |
| (VY) Vueling | 4 | 82.04% | 197,546 |
| (OS) Austrian | 5 | 82.00% | 95,708 |
| (DY) Norwegian Air Shuttle | 6 | 81.29% | 71,561 |
| (AZ) ITA Airways | 7 | 80.29% | 91,841 |
| (D8) Norwegian Air Sweden | 8 | 79.03% | 41,215 |
| (AY) Finnair | 9 | 75.16% | 45,727 |
| (LO) LOT – Polish Airlines | 10 | 75.08% | 85,902 |
Top 10 Airlines In Latin America
| Airline | On-time ranking | On-time arrival | Total flights |
| (AD) Azul | 1 | 88.93% | 279,722 |
| (H2) Sky Airline | 2 | 88.74% | 27,161 |
| (CM) Copa Airlines | 3 | 88.02% | 104,083 |
| (LA) LATAM Airlines | 4 | 86.31% | 451,651 |
| (AV) SA AVIANCA | 5 | 83.48% | 144,525 |
| (AR) Aerolineas Argentinas | 6 | 82.02% | 94,982 |
| (AM) Aeromexico | 7 | 75.83% | 113,814 |
| (Y4) Volaris | 8 | 71.61% | 187,502 |
Top 10 Airlines In Asia Pacific
| Airline | On-time ranking | On-time arrival | Total flights |
| (FD) Thai AirAsia | 1 | 91.56% | 66,043 |
| (NH) ANA | 2 | 88.61% | 162,370 |
| (JL) JAL | 3 | 88.00% | 165,981 |
| (HO) Juneyao Airlines | 4 | 86.65% | 88,115 |
| (6E) IndiGo | 5 | 84.11% | 561,864 |
| (I5) AirAsia India | 6 | 83.70% | 60,882 |
| (NZ) Air New Zealand | 7 | 81.29% | 156,591 |
| (MH) Malaysia Airlines | 8 | 80.99% | 95,962 |
| (UK) Vistara | 9 | 80.98% | 87,901 |
| (MM) Peach Aviation | 10 | 79.81% | 56,176 |
Top 10 Airlines In the Middle East and Africa
| Airline | On-time ranking | On-time arrival | Total flights |
| (WY) Oman Air | 1 | 91.38% | 29,631 |
| (RJ) Royal Jordanian | 2 | 86.76% | 28,887 |
| (KU) Kuwait Airways | 3 | 81.64% | 25,982 |
| (EK) Emirates | 4 | 81.30% | 137,589 |
| (QR) Qatar Airways | 5 | 78.32% | 152,377 |
| (ET) Ethiopian Airlines | 6 | 77.30% | 102,571 |
| (ME) Middle East Airlines | 7 | 75.91% | 20,654 |
| (AT) Royal Air Maroc | 8 | 72.01% | 45,062 |
| (LY) EL AL | 9 | 69.80% | 23,274 |
| (SV) Saudia | 10 | 69.75% | 172,797 |
Top 10 Low-Cost Airlines for On-Time Performance in 2022
| Airline | On-time ranking | On-time arrival | Total flights |
| (7G) StarFlyer | 1 | 95.23% | 21,894 |
| (6J) Solaseed Air | 2 | 94.53% | 27,486 |
| (FD) Thai AirAsia | 3 | 91.56% | 66,043 |
| (AD) Azul | 4 | 88.93% | 279,722 |
| (H2) Sky Airline | 5 | 88.74% | 27,161 |
| (HD) Air Do | 6 | 88.34% | 22,187 |
| (6E) IndiGo | 7 | 84.11% | 561,864 |
| (I2) Iberia Express | 8 | 83.80% | 35,665 |
| (I5) AirAsia India | 9 | 83.70% | 60,882 |
| (VY) Vueling | 10 | 82.04% | 197,546 |
Cirium claims that its data, which is based on the largest and deepest pool of data gathered and curated from more than 600 sources of real-time flight information, is intended to give industry stakeholders a neutral, third-party perspective.
These include the airlines themselves, airports, GDSs, positional data, civil aviation authorities, providers of air navigation services, partnerships with proprietary data, and the internet.
Follow and connect with us on Facebook, Twitter, LinkedIn, Instagram and Google News for the latest travel news and updates!


